
Search for Indicators
First 5 Indicators
First 5 Placer Children and Families Commission is an autonomous, self-governing Commission appointed by the Board of Supervisors. Each Commissioner is a community volunteer with specialized expertise or interest in the County’s youngest children. The primary purpose of the Commission is to support the healthy development of children through age 5 by creating and implementing a strategic plan for the use of Proposition 10 Tobacco Tax funds.
Since its establishment, First 5 Placer has invested more than $29 million in services for the local community. From 2007 – 2010, $8.4 million dollars were invested in Placer County programs for health care (including dental and vision care), developmental screenings, obesity prevention, quality child care, preschool, parent education, family support services, and many others.
First 5 Placer identified the indicators on this page as important to their mission of supporting the healthy development of children.
Indicator Gauge Icon Legend
Legend Colors
Red is bad, green is good, blue is not statistically different/neutral.
Compared to Distribution
 the value is in the best half of communities.
 the value is in the 2nd worst quarter of communities.
 the value is in the worst quarter of communities.
Compared to Target
 meets target;
  does not meet target.
Compared to a Single Value
 lower than the comparison value;
 higher than the comparison value;
 not statistically different from comparison value.
Trend

 non-significant change over time;
 significant change over time;
  no change over time.
Compared to Prior Value
 higher than the previous measurement period;
 lower than the previous measurement period;
 no statistically different change from previous measurement period.
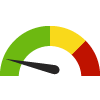
Mothers who Received Early Prenatal Care
Value
Compared to:
Mothers who Received Early Prenatal Care County: Placer
Mothers who Received Early Prenatal Care County: Placer
88.0%
(2019-2021)
Compared to:
CA Counties
The distribution is based on data from 58 California counties.
CA Value
(87.9%)
The regional value is compared to the California state value.
US Value
(78.3% in 2021)
The regional value is compared to the national value. The source for the national value is Centers for Disease Control and Prevention
Prior Value
(87.5%)
Prior Value compares a measured value with the previously measured value. Confidence intervals were taken into account in determining the direction of the comparison.
Trend
This comparison measures the indicator’s values over multiple time periods.<br>The Mann-Kendall Test for Statistical Significance is used to evaluate the trend<br>over 4 to 10 periods of measure, subject to data availability and comparability.
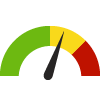
Kindergartners with Required Immunizations
Value
Compared to:
Kindergartners with Required Immunizations County: Placer
Kindergartners with Required Immunizations County: Placer
92.9%
(2021-2022)
Compared to:
CA Counties
The distribution is based on data from 56 California counties.
CA Value
(92.8%)
The regional value is compared to the California state value.
Prior Value
(92.7%)
Prior Value compares a measured value with the previously measured value. Confidence intervals were not taken into account in determining the direction of the comparison.
Trend
This comparison measures the indicator’s values over multiple time periods.<br>The Mann-Kendall Test for Statistical Significance is used to evaluate the trend<br>over 4 to 10 periods of measure, subject to data availability and comparability.
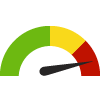
Children who Visited a Dentist
Value
Compared to:
Children who Visited a Dentist County: Placer
Children who Visited a Dentist County: Placer
84.9%
(2019-2020)
Compared to:

CA Value
(89.5%)
The regional value is compared to the California state value.
Prior Value
(82.5%)
Prior Value compares a measured value with the previously measured value. Confidence intervals were taken into account in determining the direction of the comparison.
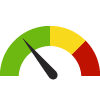
Children who Visited a Dentist Zip Code: 95602
Children who Visited a Dentist Zip Code: 95602
84.3%
(2019-2020)
Compared to:

Placer, CA County Value
(84.9%)
The regional value is compared to the Placer County value.
Prior Value
(86.9%)
Prior Value compares a measured value with the previously measured value. Confidence intervals were taken into account in determining the direction of the comparison.
Children who Visited a Dentist Zip Code: 95603
Children who Visited a Dentist Zip Code: 95603
81.8%
(2015-2016)
Compared to:
Placer, CA County Value
(82.5%)
The regional value is compared to the Placer County value.
Children who Visited a Dentist Zip Code: 95648
Children who Visited a Dentist Zip Code: 95648
81.7%
(2019-2020)
Compared to:
Placer, CA County Value
(84.9%)
The regional value is compared to the Placer County value.
Prior Value
(81.3%)
Prior Value compares a measured value with the previously measured value. Confidence intervals were taken into account in determining the direction of the comparison.
Children who Visited a Dentist Zip Code: 95650
Children who Visited a Dentist Zip Code: 95650
83.5%
(2015-2016)
Compared to:
Placer, CA County Value
(82.5%)
The regional value is compared to the Placer County value.
Children who Visited a Dentist Zip Code: 95677
Children who Visited a Dentist Zip Code: 95677
81.9%
(2019-2020)
Compared to:
Placer, CA County Value
(84.9%)
The regional value is compared to the Placer County value.
Children who Visited a Dentist Zip Code: 95678
Children who Visited a Dentist Zip Code: 95678
81.3%
(2019-2020)
Compared to:
Placer, CA County Value
(84.9%)
The regional value is compared to the Placer County value.
Children who Visited a Dentist Zip Code: 95746
Children who Visited a Dentist Zip Code: 95746
80.0%
(2015-2016)
Compared to:
Placer, CA County Value
(82.5%)
The regional value is compared to the Placer County value.
Children who Visited a Dentist Zip Code: 95747
Children who Visited a Dentist Zip Code: 95747
85.8%
(2019-2020)
Compared to:
Placer, CA County Value
(84.9%)
The regional value is compared to the Placer County value.
Prior Value
(82.3%)
Prior Value compares a measured value with the previously measured value. Confidence intervals were taken into account in determining the direction of the comparison.
Children who Visited a Dentist Zip Code: 95765
Children who Visited a Dentist Zip Code: 95765
84.0%
(2015-2016)
Compared to:
Placer, CA County Value
(82.5%)
The regional value is compared to the Placer County value.
